
Sonar Range Prediction and Global Ocean Information System
WADER is a sonar range prediction and global ocean information system for enhancing situational awareness anywhere in the world.
The system uses global environmental data (sea state, water column and bathymetry) together with user-supplied acoustic parameters to generate propagation loss data and calculate sonar performance / probability of detection. Designed for operational users of all abilities, the data is generated in real time and displayed using clear graphics.
The correct interpretation of the graphs can provide command information such as best evasion depth, likely target depths and optimum sonar position. The system is fully range-dependent and the embedded models have been independently verified.
Using the system
WADER is designed to provide comprehensive capabilities within a user-friendly package. The system shields a new user from the complexities of underwater acoustic range prediction while simultaneously providing an experienced operator with advanced options to perform detailed calculations without significantly increasing the workload or complexity.
WADER applications include research, training, teaching, EIA, operational sonar performance prediction, anti-submarine warfare (ASW), as well as pre and post-mission acoustic analysis.
The process is rapid, reliable and simple. It is controlled via four main screens.
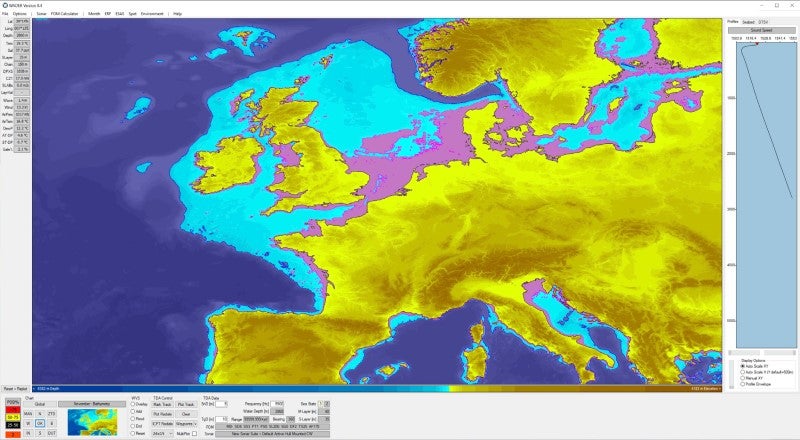
Main screen
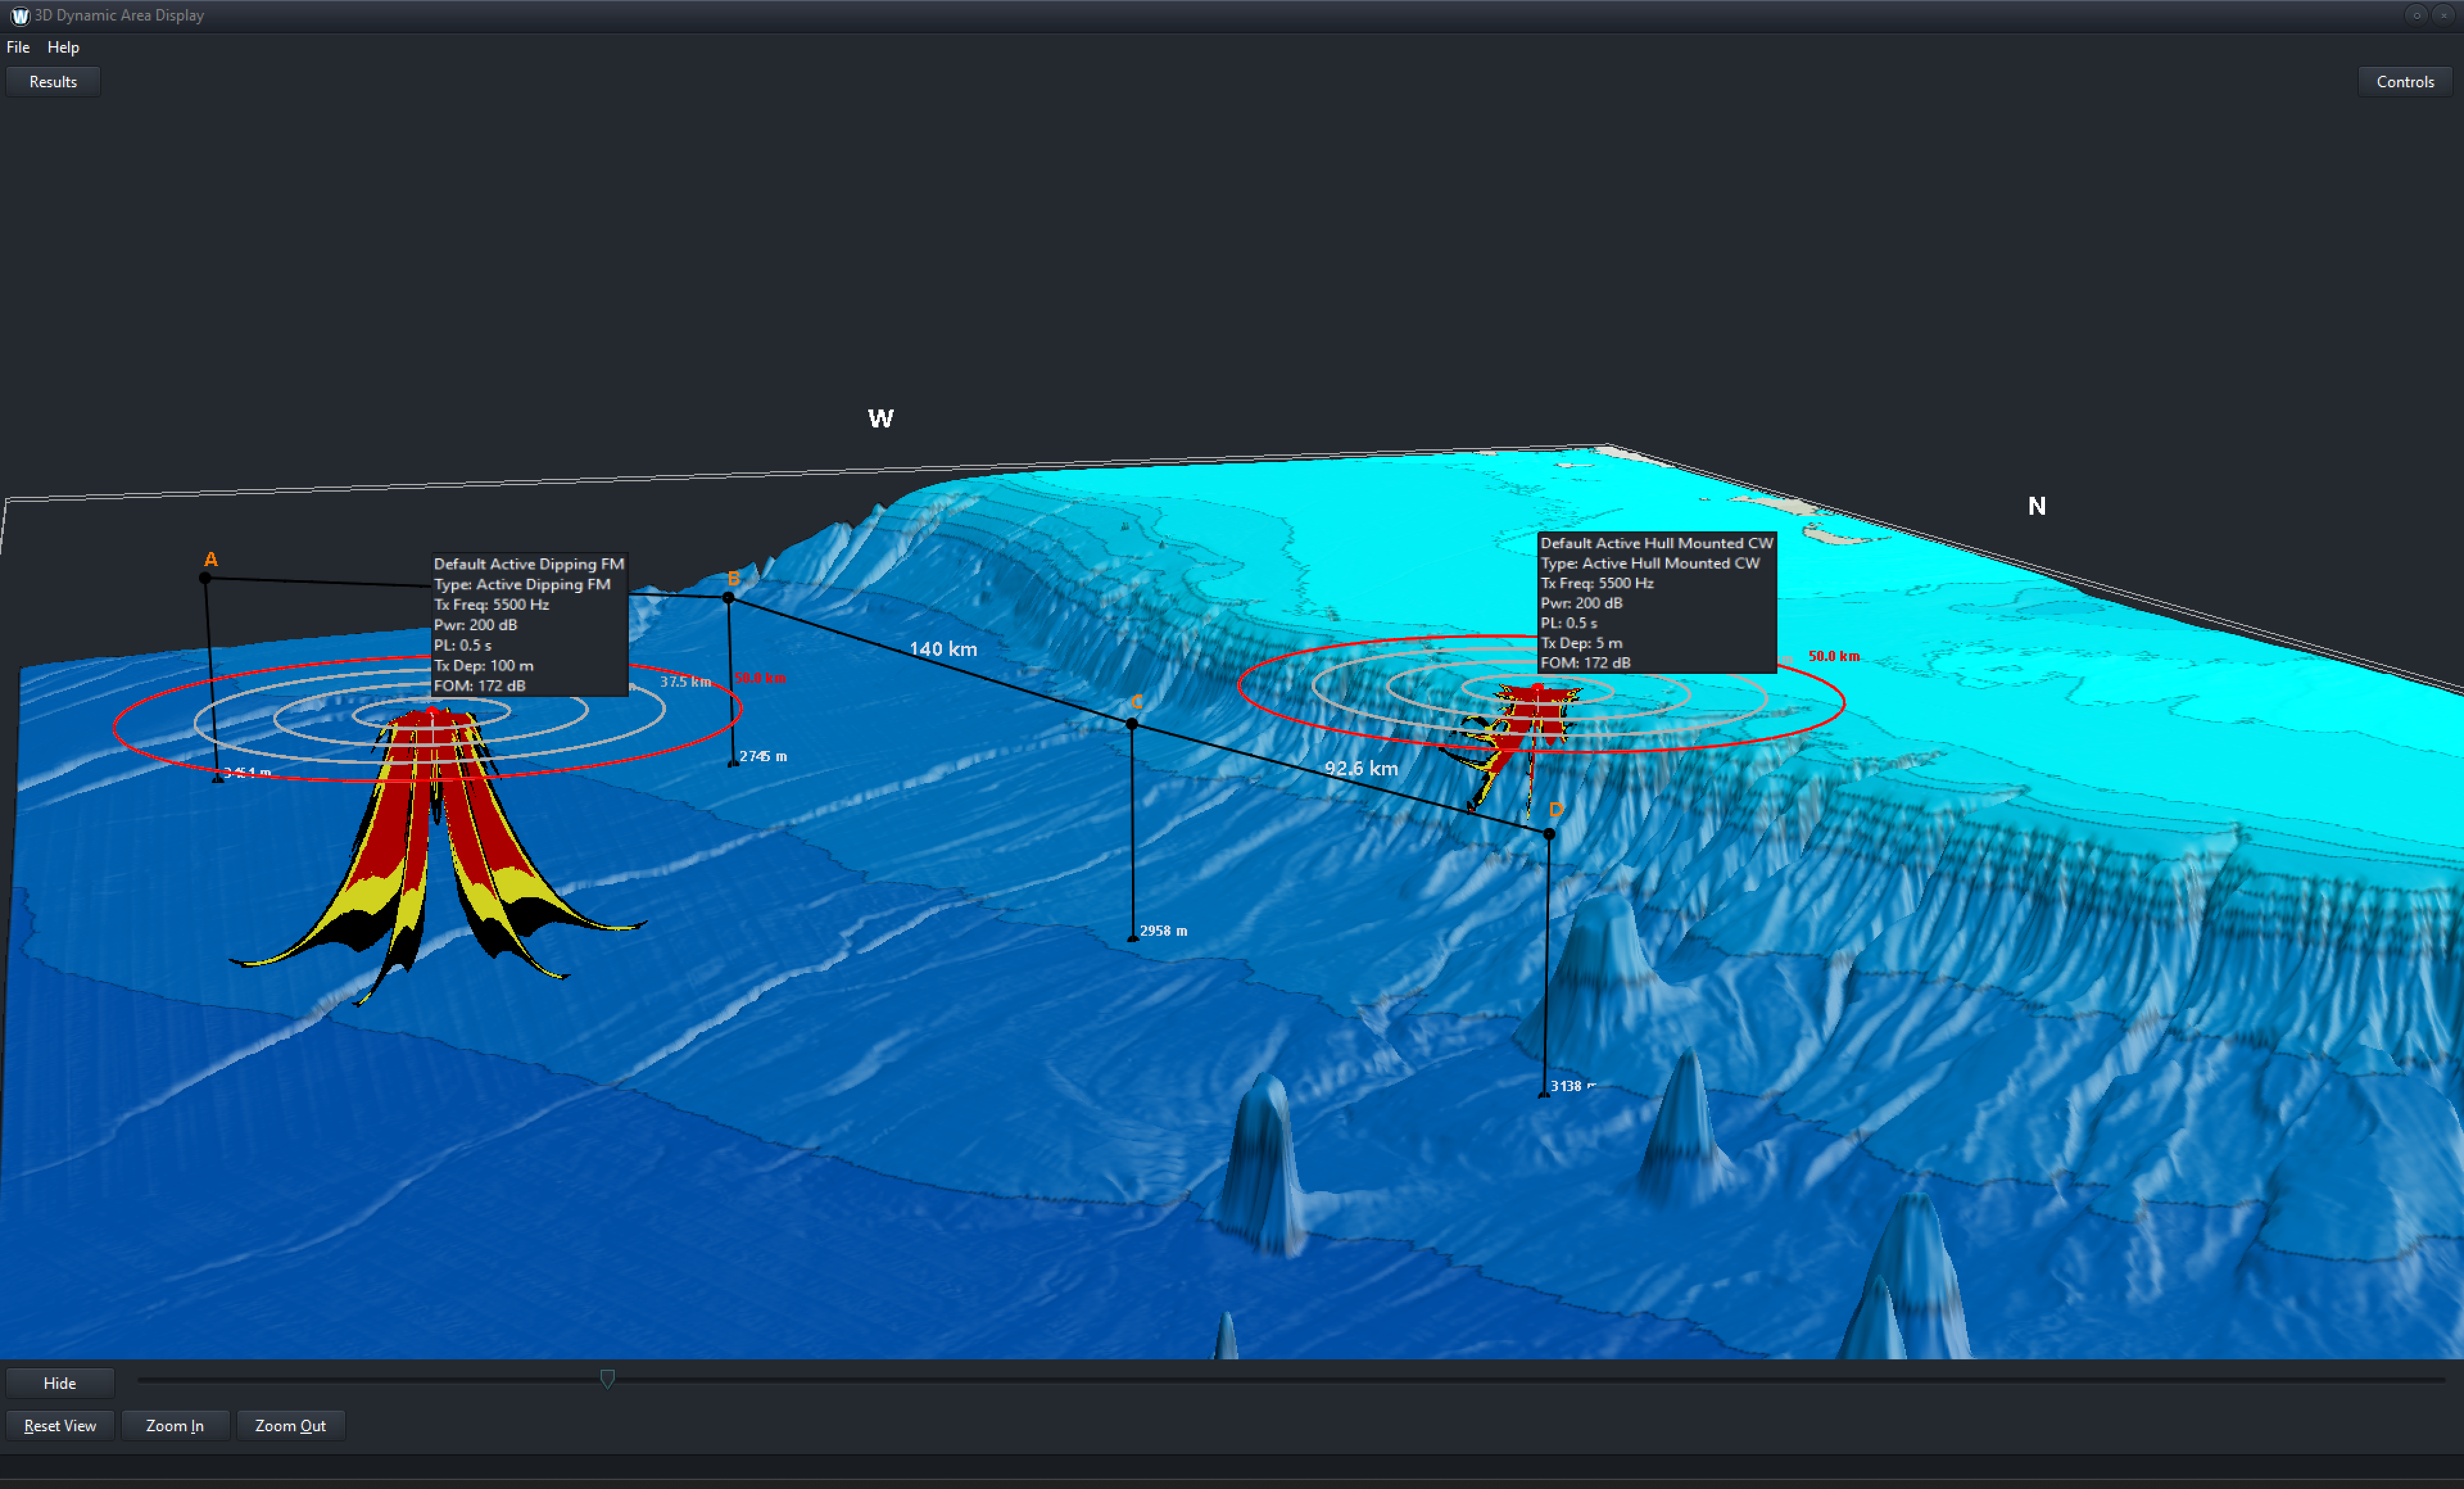
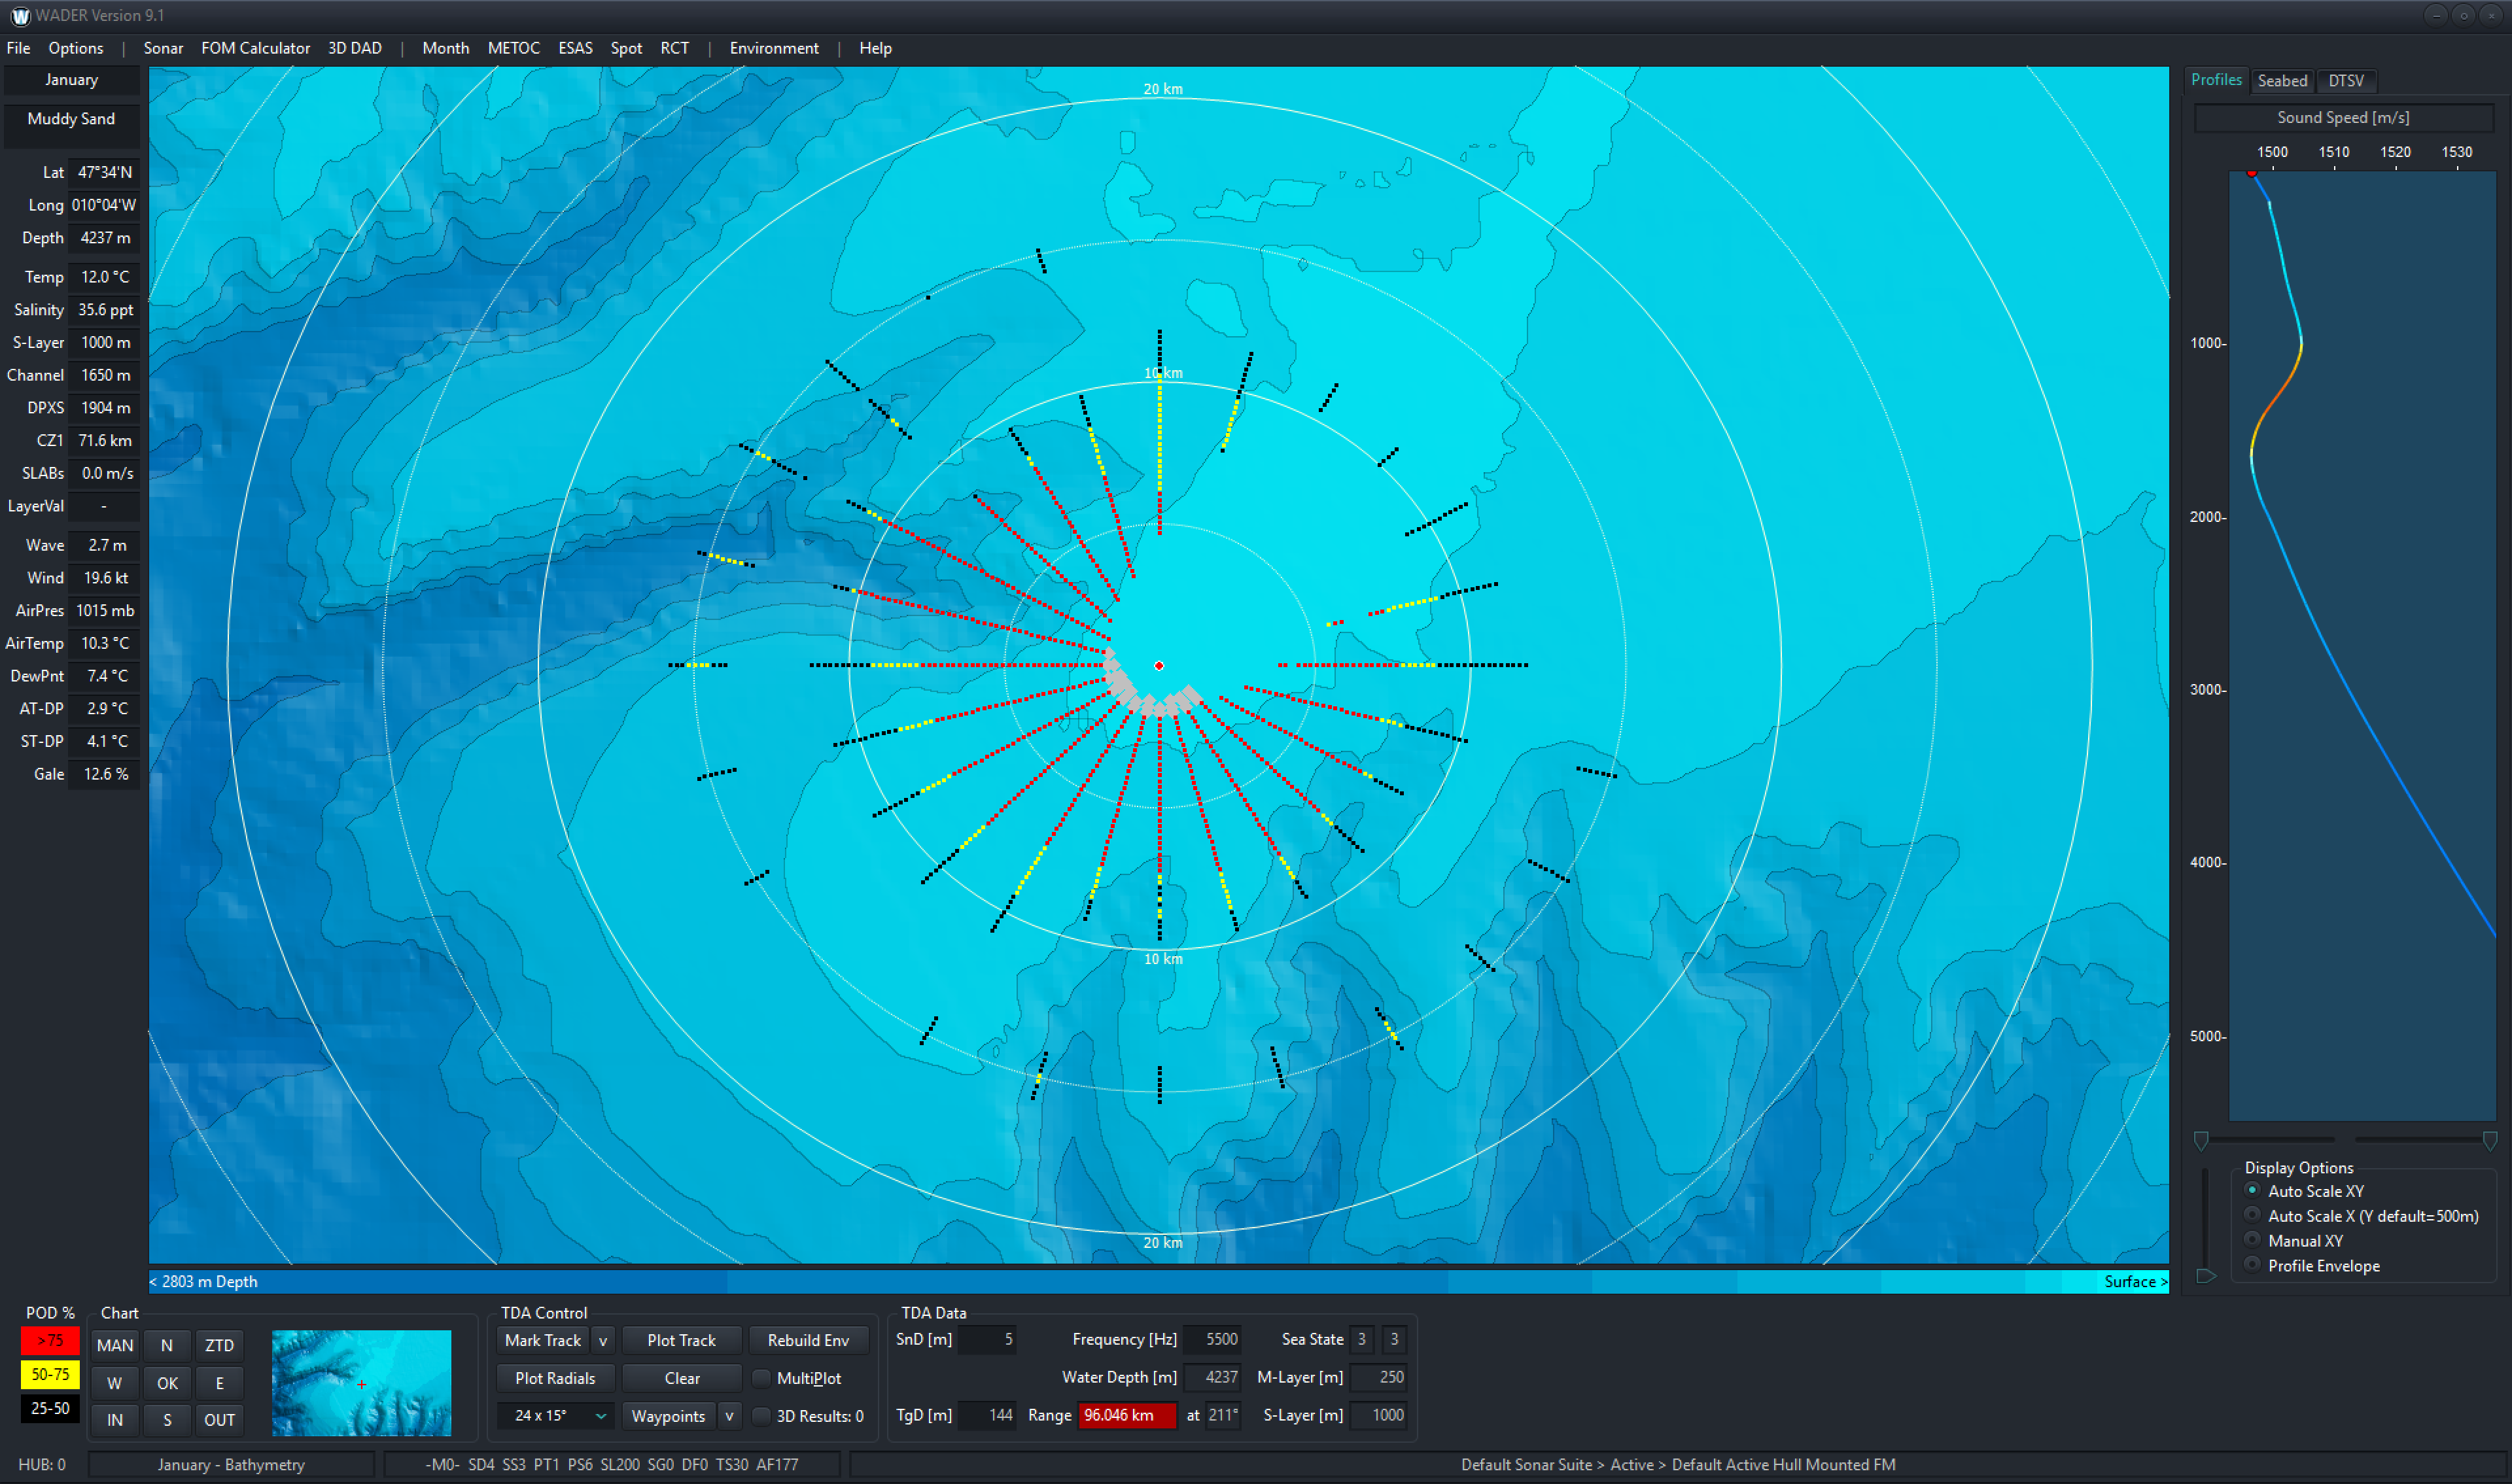
The main screen is the starting point for calculations where users define their area of interest and add detail to the map display. The main screen renders the 2D sonar performance radial displays and provides access to 3D DAD. In addition to the on-screen climatology data readouts, optional overlays include:
- Sediment data charts
- Ambient noise and weather data (with third party product access)
- Global port locations and ocean place names
- User-defined area boundaries
Environment screen
The environment screen allows users to edit the track and operational environment. Users upload and manage their own (measured) environment profiles (salinity, SSP) from XBTs using time filters, edit the seabed properties and analyse the sound channel.
The data is visualised using the seabed cross-section and profile charts. High-resolution water column profiles can be merged automatically with the tack for use in the analysis screen.
Analysis screen
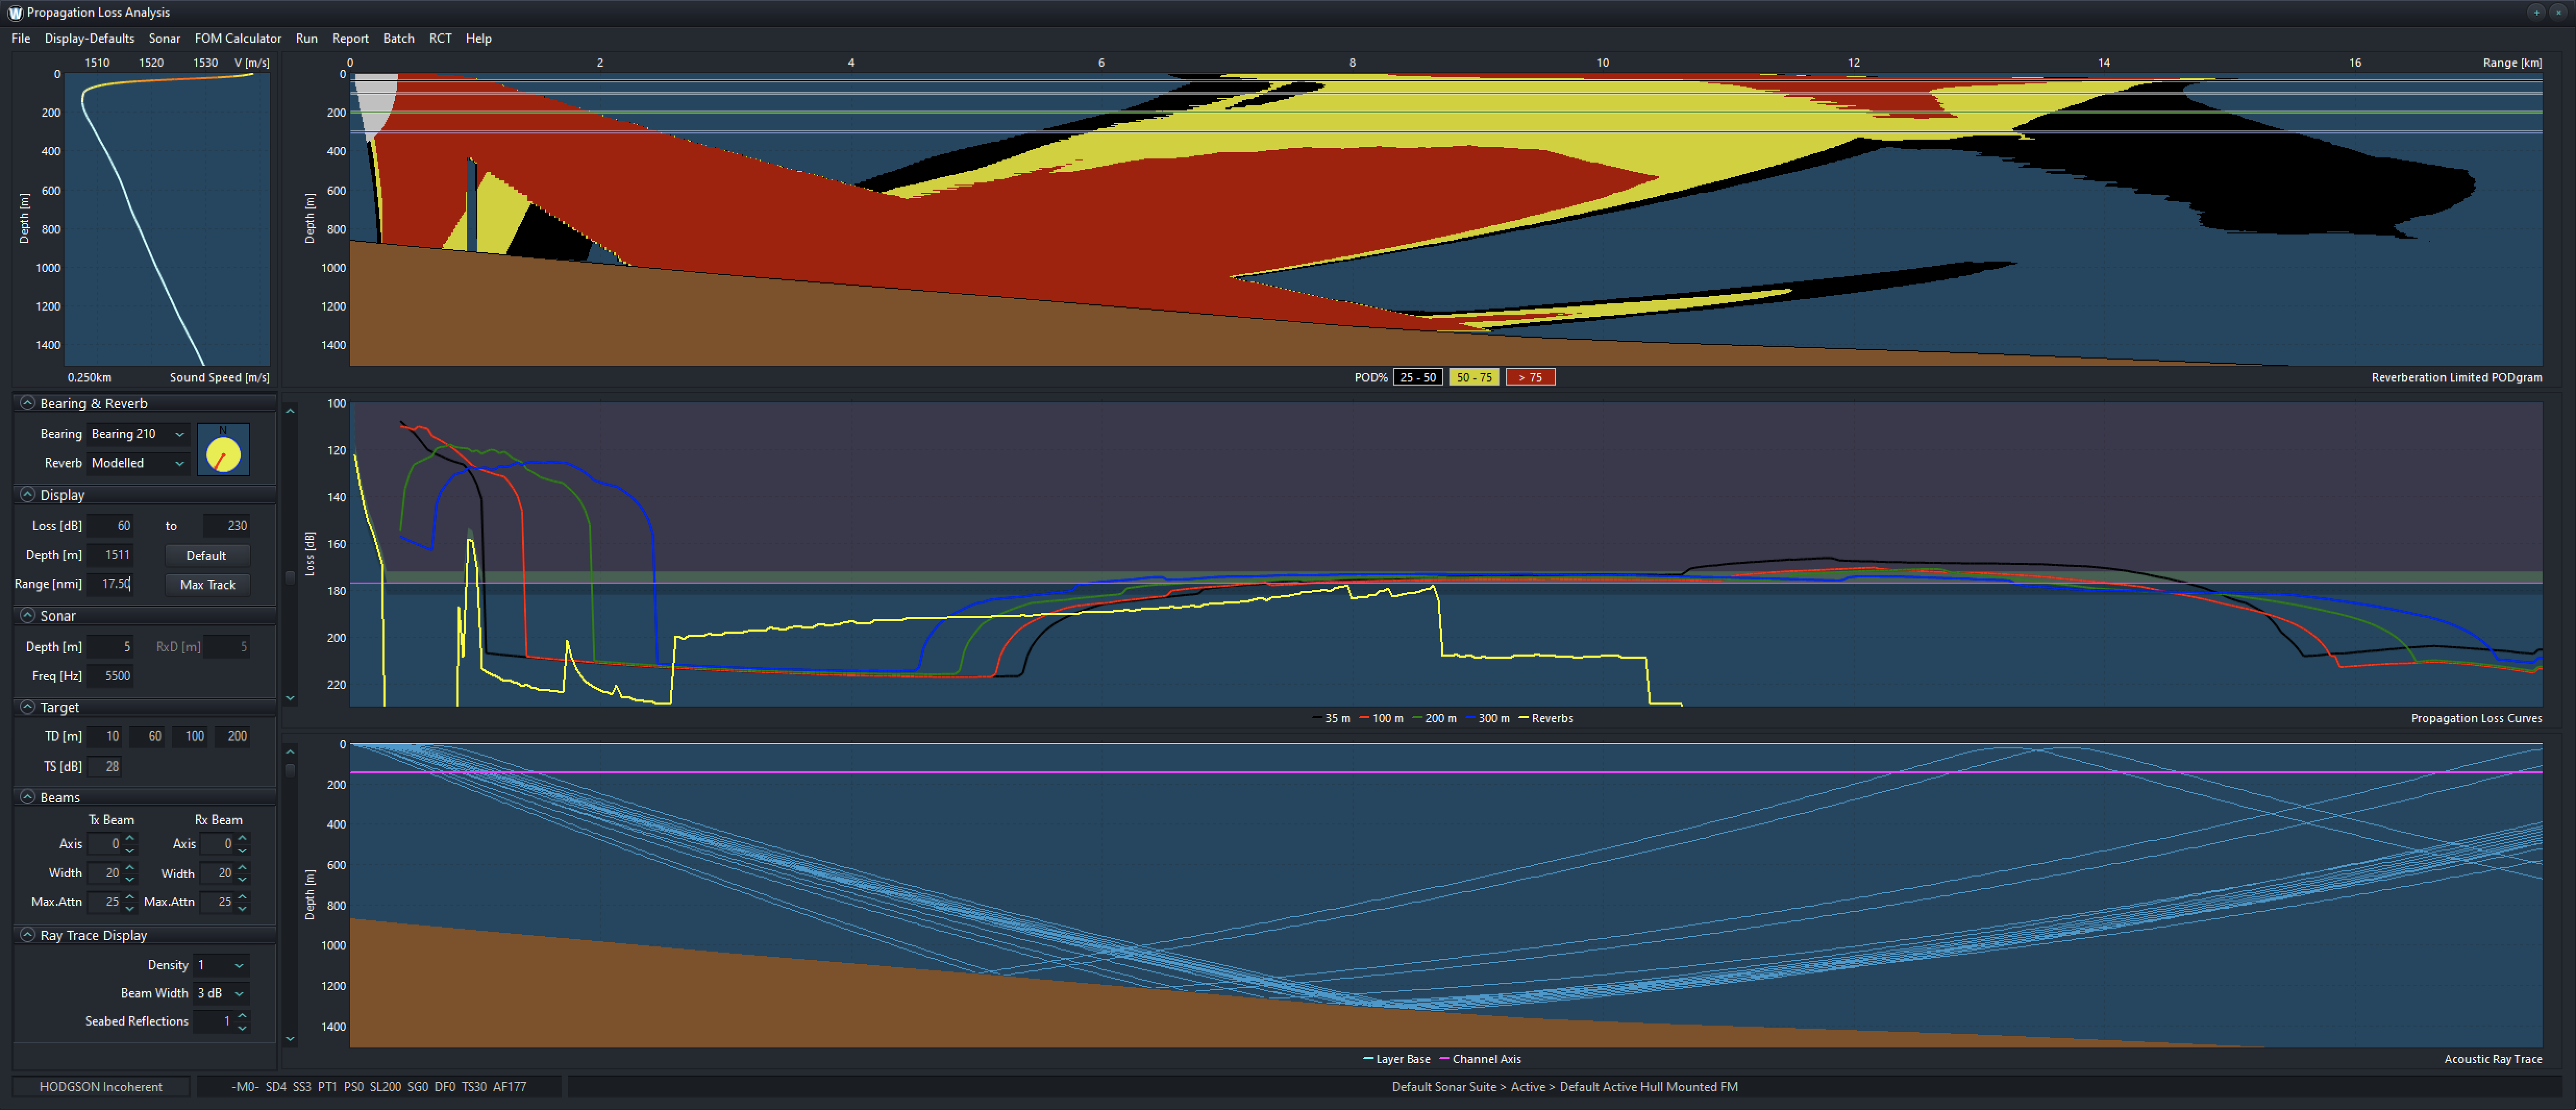
The analysis screen is where the user conducts detailed propagation loss analysis. The screen has a probability of detection diagram, propagation loss graphic and ray-trace diagram. Users can also display an EIA chart, best source depth and intensity distribution chart. In situ adjustments can be made for reverberation losses, target / source depths and sonar beam angle. Parameters for shipping, sea state and ambient noise are accounted for in the embedded FOM calculators.
Sonar editor
The sonar editor is where users add their own sonar parameters for use in their range prediction processes. WADER is supplied with a set of fictitious sonars – SPUTS – for training purposes.
WADER has been developed over 20 years and the graphical user interface (GUI) is the result of OAD design effort and substantial feedback from informed users in the military and civilian research communities. With WADER, there are no add-ons to purchase or hidden extras – every user has access to every feature of the program immediately. The product is regularly upgraded and upgrades are released as part of our Annual Upgrade Plan.